Scrutiny on OPNsense (S.M.A.R.T Monitoring)
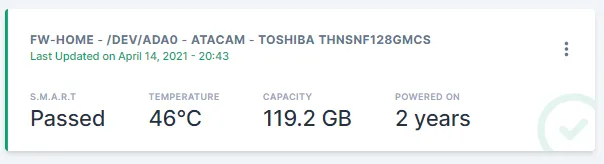
I’ve been using Scrutiny by AnalogJ since the start of January to report S.M.A.R.T data of my HDDs and SSDs. The purpose of this is to alert me when the SMART status of a drive fails via an email. Other method are also available, such as Telegram. I’m currently reporting 21 drives to Scrutiny, from 4 Linux servers and a physical OPNsense box (my other 3 OPNsense boxes are virtualised).
You can find out more about the Scrutiny and how to install the WebUI on the Github page. Scrutiny repo is currently is inactive, but the maintainer AnalogJ has been busy with other commitments and will be working on the project again soon. The project is now active again (25th April 2021)
https://github.com/AnalogJ/scrutiny/
How to install Scrutiny collector on OPNsense
AnalogJ has added FreeBSD support to the collector but currently you can only find a FreeBSD build of the collector for version 0.3.1, I’m hoping when AnalogJ manages to roll off the next release 0.3.6, he’ll include FreeBSD version once again. FreeBSD builds have now been added to new releases of Scrutiny, remember to go grab the latest binary from the releases page on the next step.
You’ll need the WebUI set up and you are able to reach it from OPNsense, we can proceed to setup the collector on OPNsense.
First of all you’ll want to SSH into OPNsense or access the console by your preferred method. We’ll want to create a folder to store our scrutiny collector, download it and make the file executable.
mkdir /conf/scrutiny/
cd /conf/scrutiny/

fetch https://github.com/AnalogJ/scrutiny/releases/download/0.3.13/scrutiny-collector-metrics-freebsd-amd64
chmod +x scrutiny-collector-metrics-linux-arm64
To make it so when the collector sends the data to the Scrutiny WebUI, it adds a host id, so we know which disks in Scrutiny are from which hosts, we need to add a little configuration yaml file, to set the host id. For this we’ll create a yaml file using vi and enter the contents below /conf/scrutiny/collector.yaml. Remember to change the change-me to the host id you want.
version: 1

host:
  id: "change-me"
Now we’ve got the collector binary and yaml configuration, we just need to setup a OPNsense action we can call using the OPNsense cron job. To add an action we need to create a conf file at the following location /usr/local/opnsense/service/conf/actions.d/actions_scrutinyCollector.conf with the below contents, you’ll want to change the api-endpoint to the url of your Scrutiny web url. Once you’ve saved this file you’ll need to reload configd for OPNsense by doing service configd restart.
## /usr/local/opnsense/service/conf/actions.d
[scrutinyCollector]
command:/conf/scrutiny/scrutiny-collector-metrics-freebsd-amd64 run --config /conf/scrutiny/collector.yaml --api-endpoint http://scrutiny.mydomain.com/
type:script_output
message:Running Scrutiny Collector
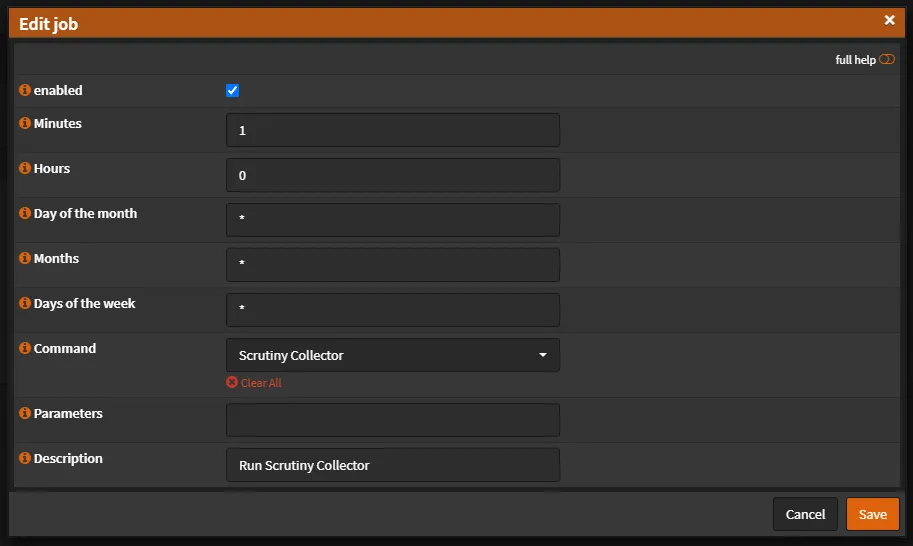
description:Scrutiny CollectorNow simply go in to OPNsense WebUI and go in to the cron section SYSTEM: SETTINGS: CRON. Then you can create a cron for the collector, normally people run the Scrutiny collector once every 24 hours. There’s an example of this below, where it’ll run it 1 minute past midnight every day.
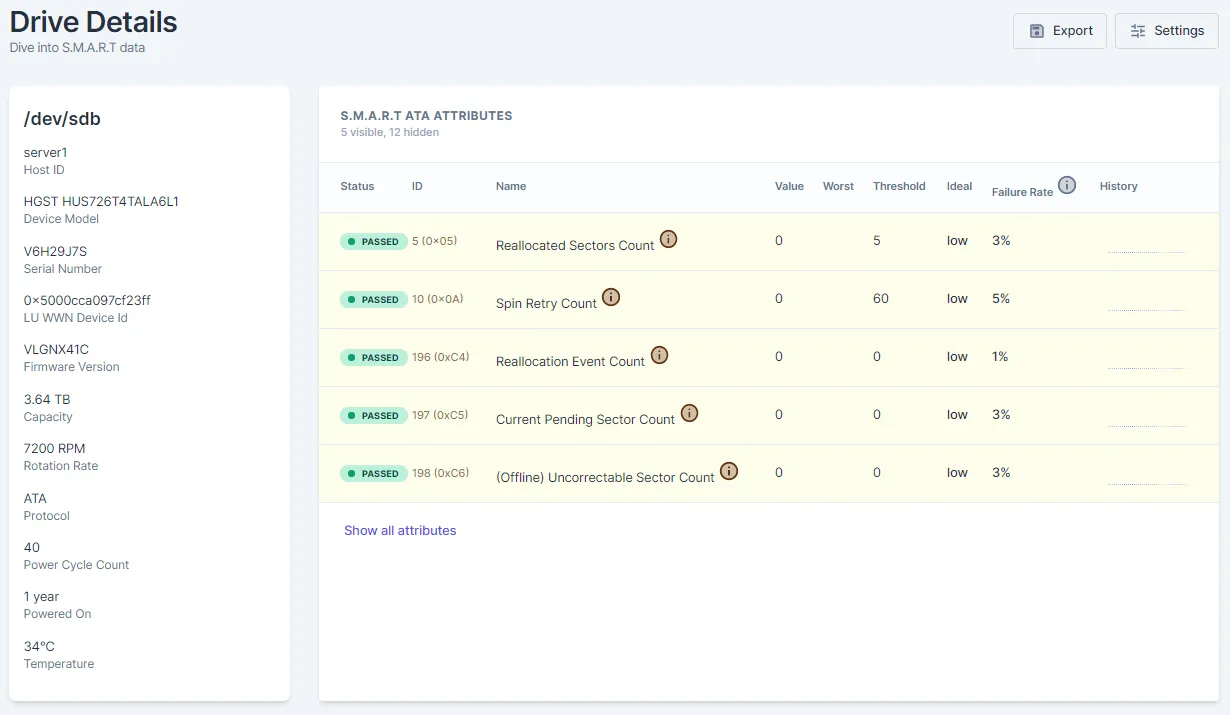
Now you should be all setup and the collector will report the S.M.A.R.T data to your Scrutiny WebUI daily. If you want to force run the collector you can do this by running the following command below, if all is successful you’ll soon see the disks of OPNsense appear in the Scrutiny WebUI.
/conf/scrutiny/scrutiny-collector-metrics-freebsd-amd64 run --config /conf/scrutiny/collector.yaml --api-endpoint http://scrutiny.mydomain.com/To check if the cron ran the next day go to SYSTEM: LOG FILES: BACKEND and search Running Scrutiny Collector, you’ll see the event log of when it ran.
Hopefully someone else finds this guide useful, since monitoring your drives on OPNsense is a very good idea and Scrutiny is good way to central all the monitoring/reporting to one place.